Flink, founded by Sergio Jiménez and Ricardo Bueno, is a Mexico-based investment platform that allows users to purchase stocks without having to pay a commission fee. With as little as $2 USD, Flink user’s are able to purchase partial shares in a company of their choosing. In an effort to increase efficiency and decrease UI-related delays that affect the user experience with the app, the PS Tool was tasked with identifying delays in the execution of Flink’s code for various user flows. This case study will focus on two optimization opportunities that were identified for Flink’s Company Detail Page user flow, and how these delays can be reduced to decrease the time it takes for users to complete the Company Detail Page user flow by ~20%.
The Problem
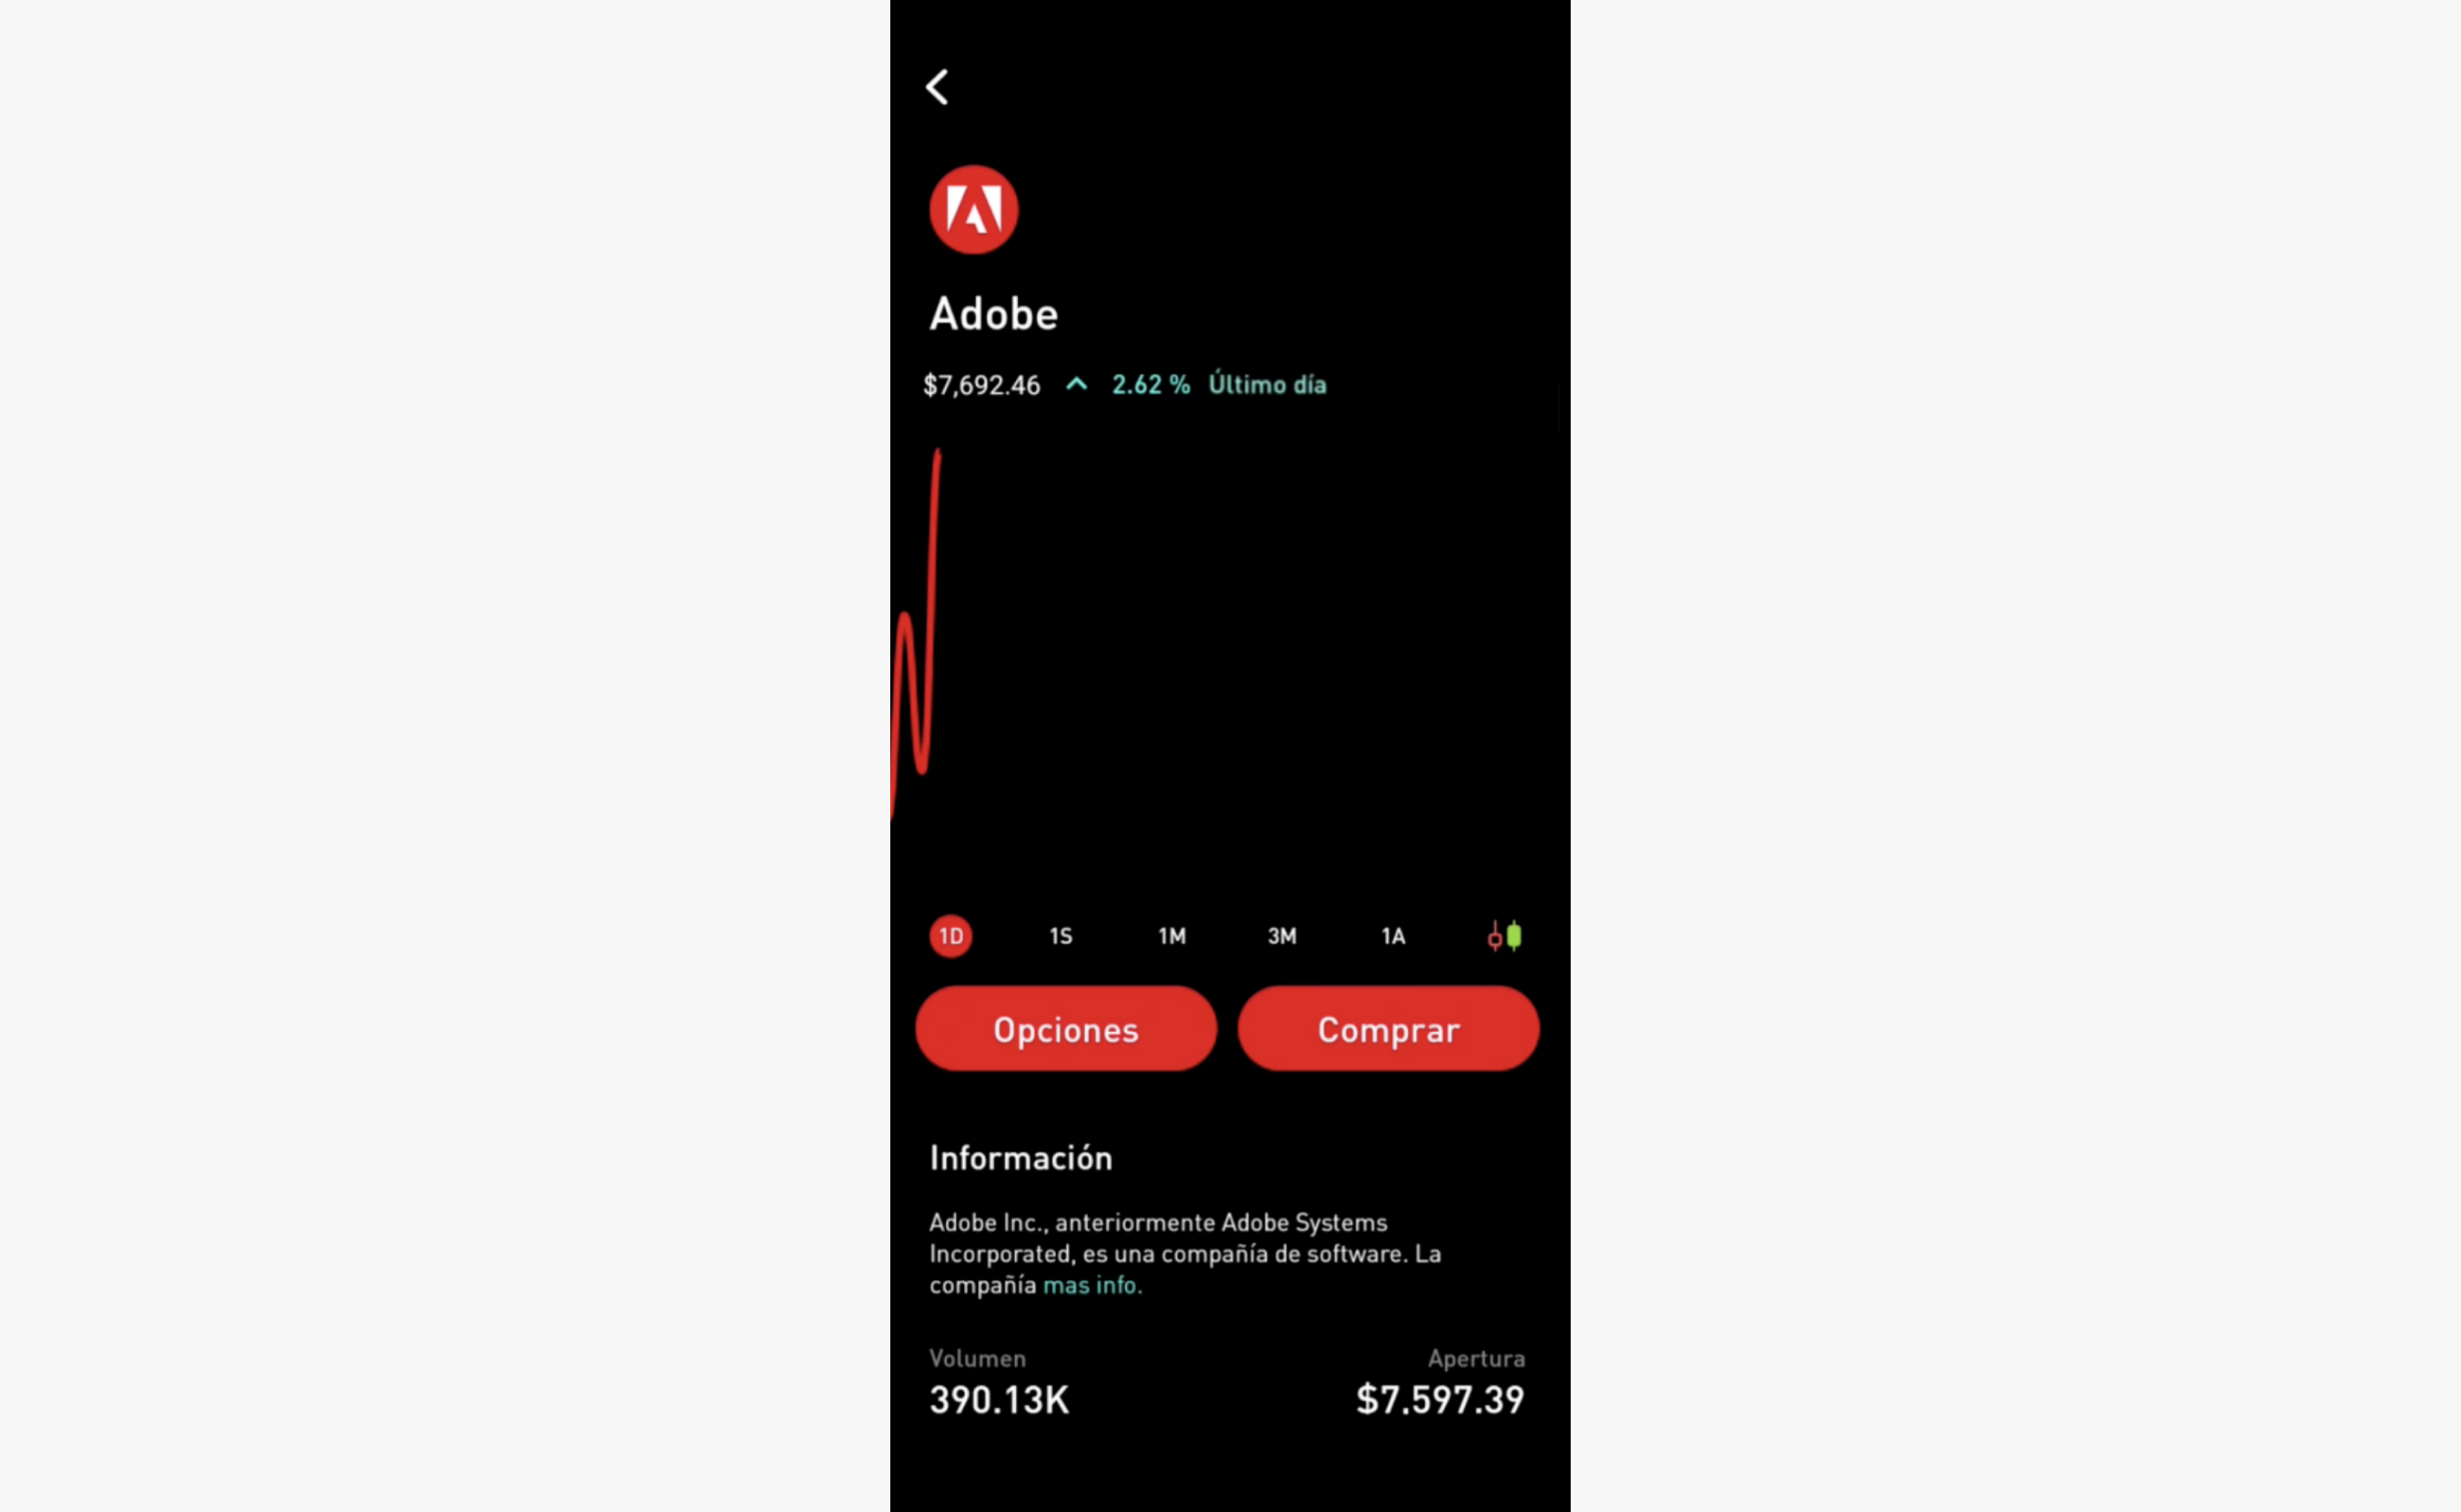
When using the Android app, users experienced a persistent delay when selecting a company to view its detail page with all relevant financial information (Pic 1). After selecting a company, it took an average of ~3300ms until the company page was fully loaded and responsive. When users deal with significant delays each time they want to select a company to learn more about it or purchase shares, that impacts their willingness to use the app and also makes it much harder to acquire new users to scale the company.

What makes the PS Tool special?
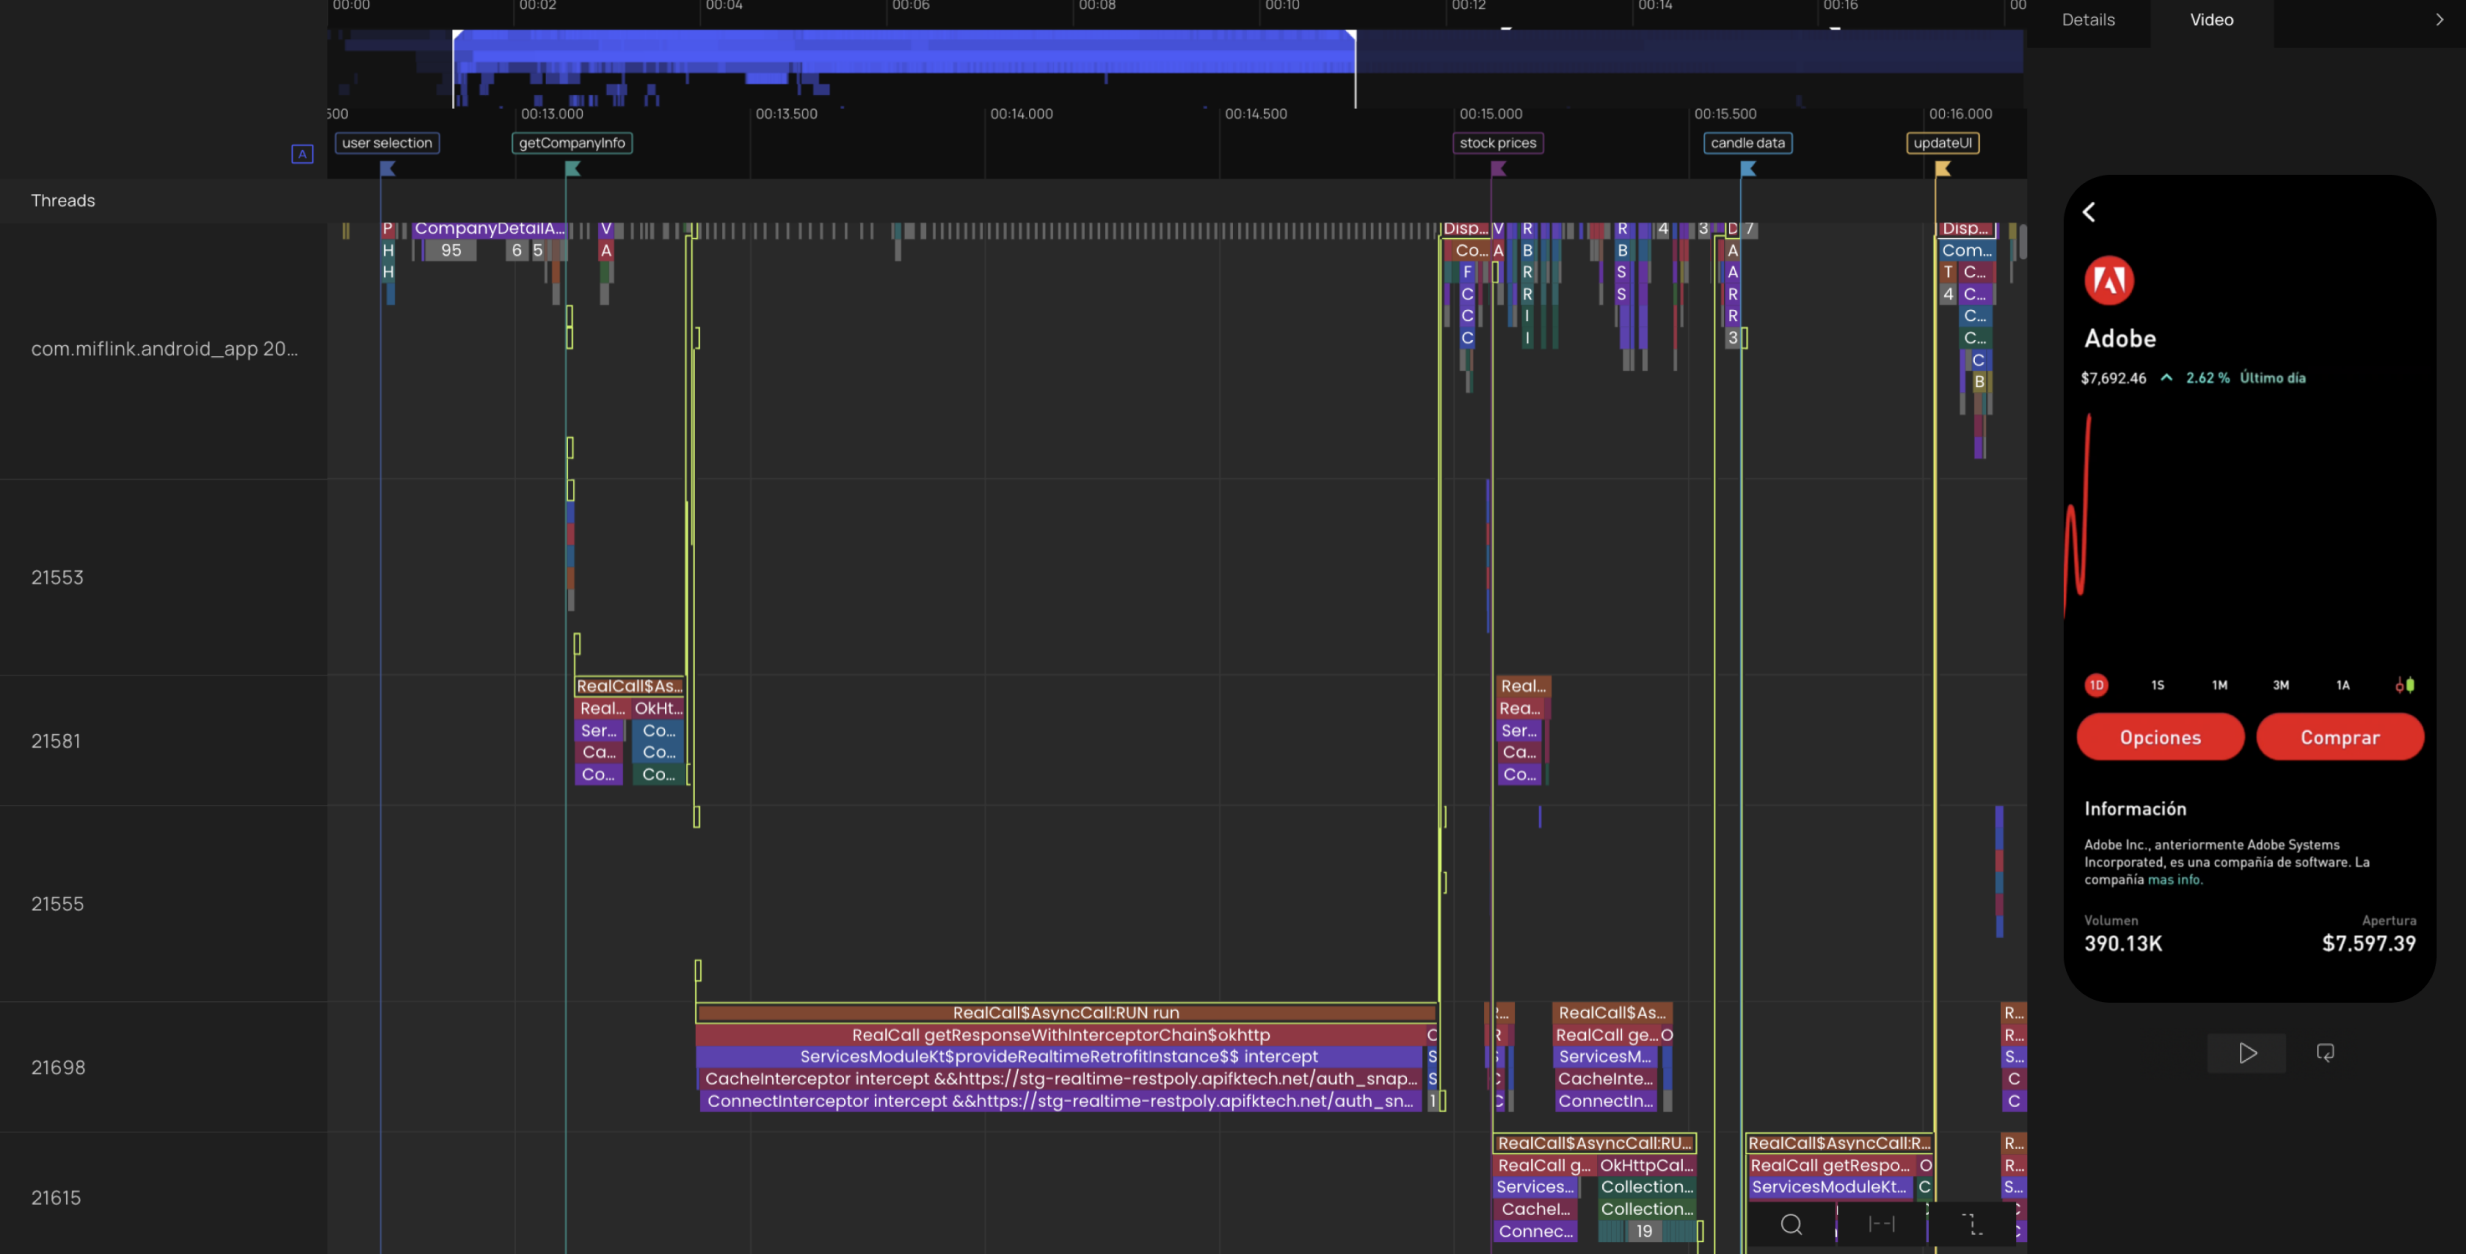
The PS Tool stands out among its competitors because it can highlight the execution paths that identify the order in which functions are called and executed. It’s also equipped with a video feature that syncs what users see in the app’s UI to the code that is being executed (Pic 2). The unique features of the PS Tool, and its user-friendly interface, was a determining factor in why Flink chose to work with Product Science to improve the speed of their Android app.

Let’s talk about user flows
The company detail page user flow consists of an action (when the user selects a company to access its detail page) and a reaction (the company detail page is fully loaded and responsive). The company detail page user flow is essential to the Flink app because in order for a user to purchase shares in a company, they must first access the company’s page, The detail pages have valuable company information, like stock price, a graph of its stock price over time, and its trading volume (Pic 3). Because there’s a lot of information on those pages, there were significant delays while waiting for that information to be loaded.

Company detail page data fetched late
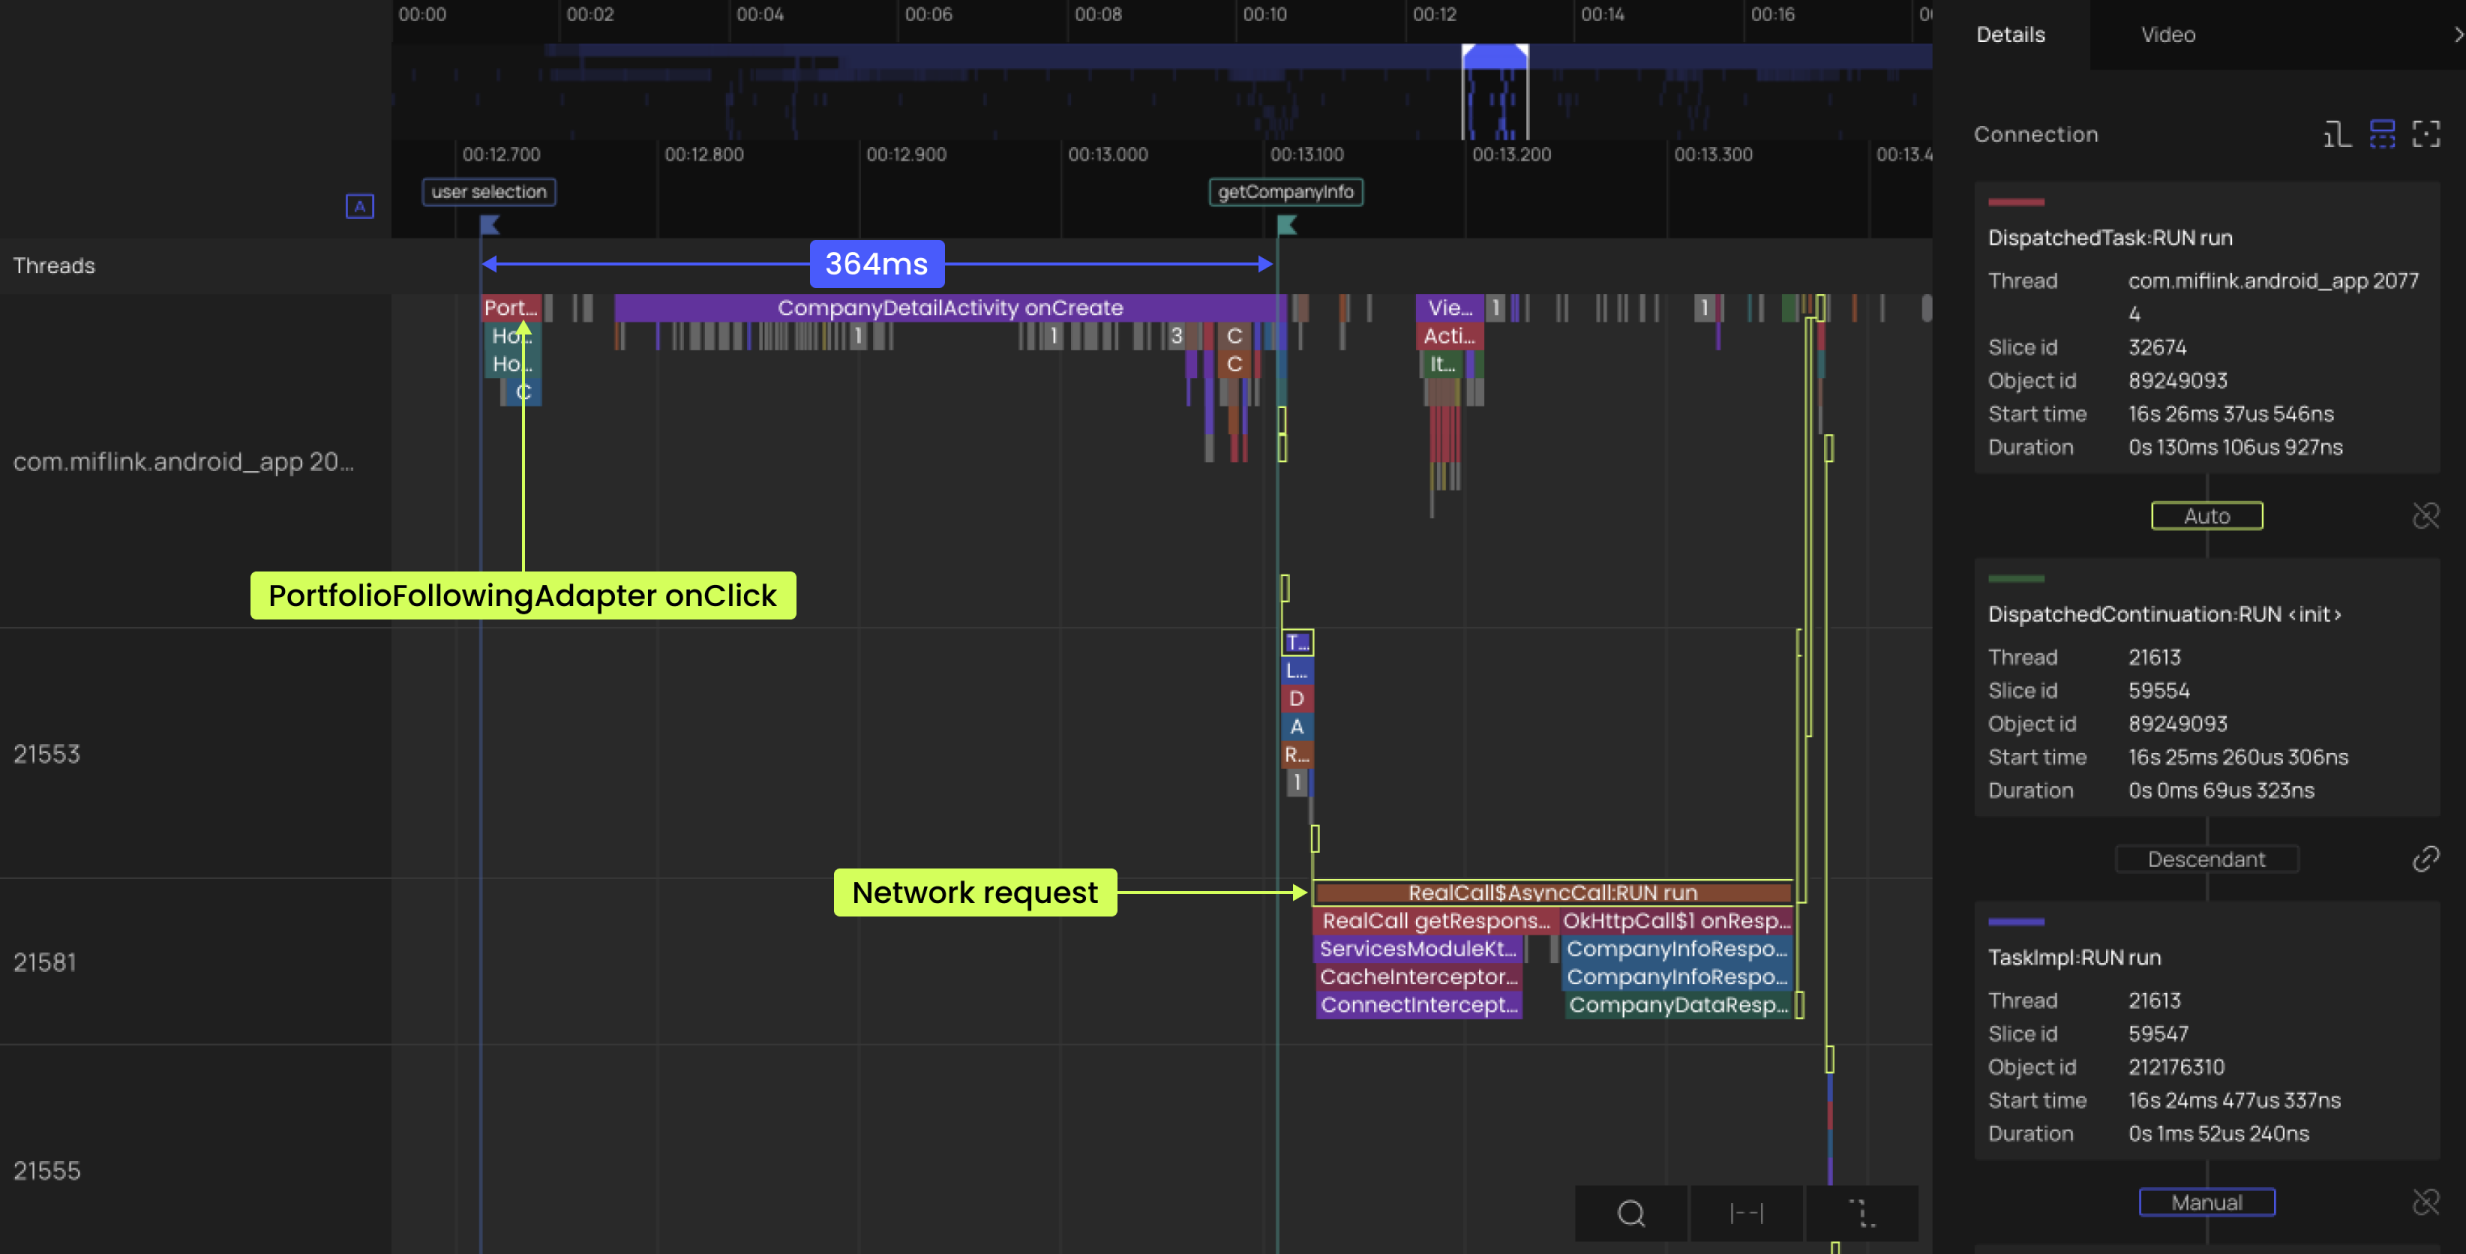
The PS Tool identified a ~364ms delay between a user’s selection of a company and the network request that’s triggered to fetch the information needed to populate the company detail page. Analysis of the slices on the trace file and execution path showed that the network request to fetch the company’s trading details was scheduled from CompanyDetailViewModel loadInfo ~364ms after the user’s tap is registered at PortfolioFollowingAdapter onClick (Pic 4). During the ~364ms before CompanyDetailViewModel loadInfo scheduled the network request, the view model for the company detail page was prepared. Thus the PS Tool shows that the network request to fetch the company details was not scheduled until after the view model for the company page was prepared.

The PS Tool found that the view model could be prepared simultaneously alongside the network request to fetch the data for the company detail page. No other tool uses connections to show the dependencies of each function and the progression of calls that are made while a user flow is being executed. In addition to the connections, the PS Tool’s video model showed the visual delay that occurs while a user waits for the data for a company detail page to be fetched. Most tools do not provide guidance on where and what should be analyzed while looking at an app’s code. The video mode and connections provided a roadmap with visuals showing exactly where and why any delays occurred.
Rather than scheduling the network request at the end of CompanyDetailActivity onCreate, which calls CompanyDetailViewModel loadInfo, the network request should’ve been scheduled to fetch the data for the company detail page in parallel with the preparation of the view model. Executing these processes in parallel would save ~240ms, which is the time it took to execute the network request after the view model was prepared.
Company chart delayed until all data had been fetched
The PS Tool identified a second delay when waiting for the company graph to load. There were two ways to view the graph: as a line chart or a candle chart. The default view for the graph was a line chart, and to access the candle chart, a user had to select the candle icon to change the view. The PS Tool showed that two network requests were executed before the chart was shown.
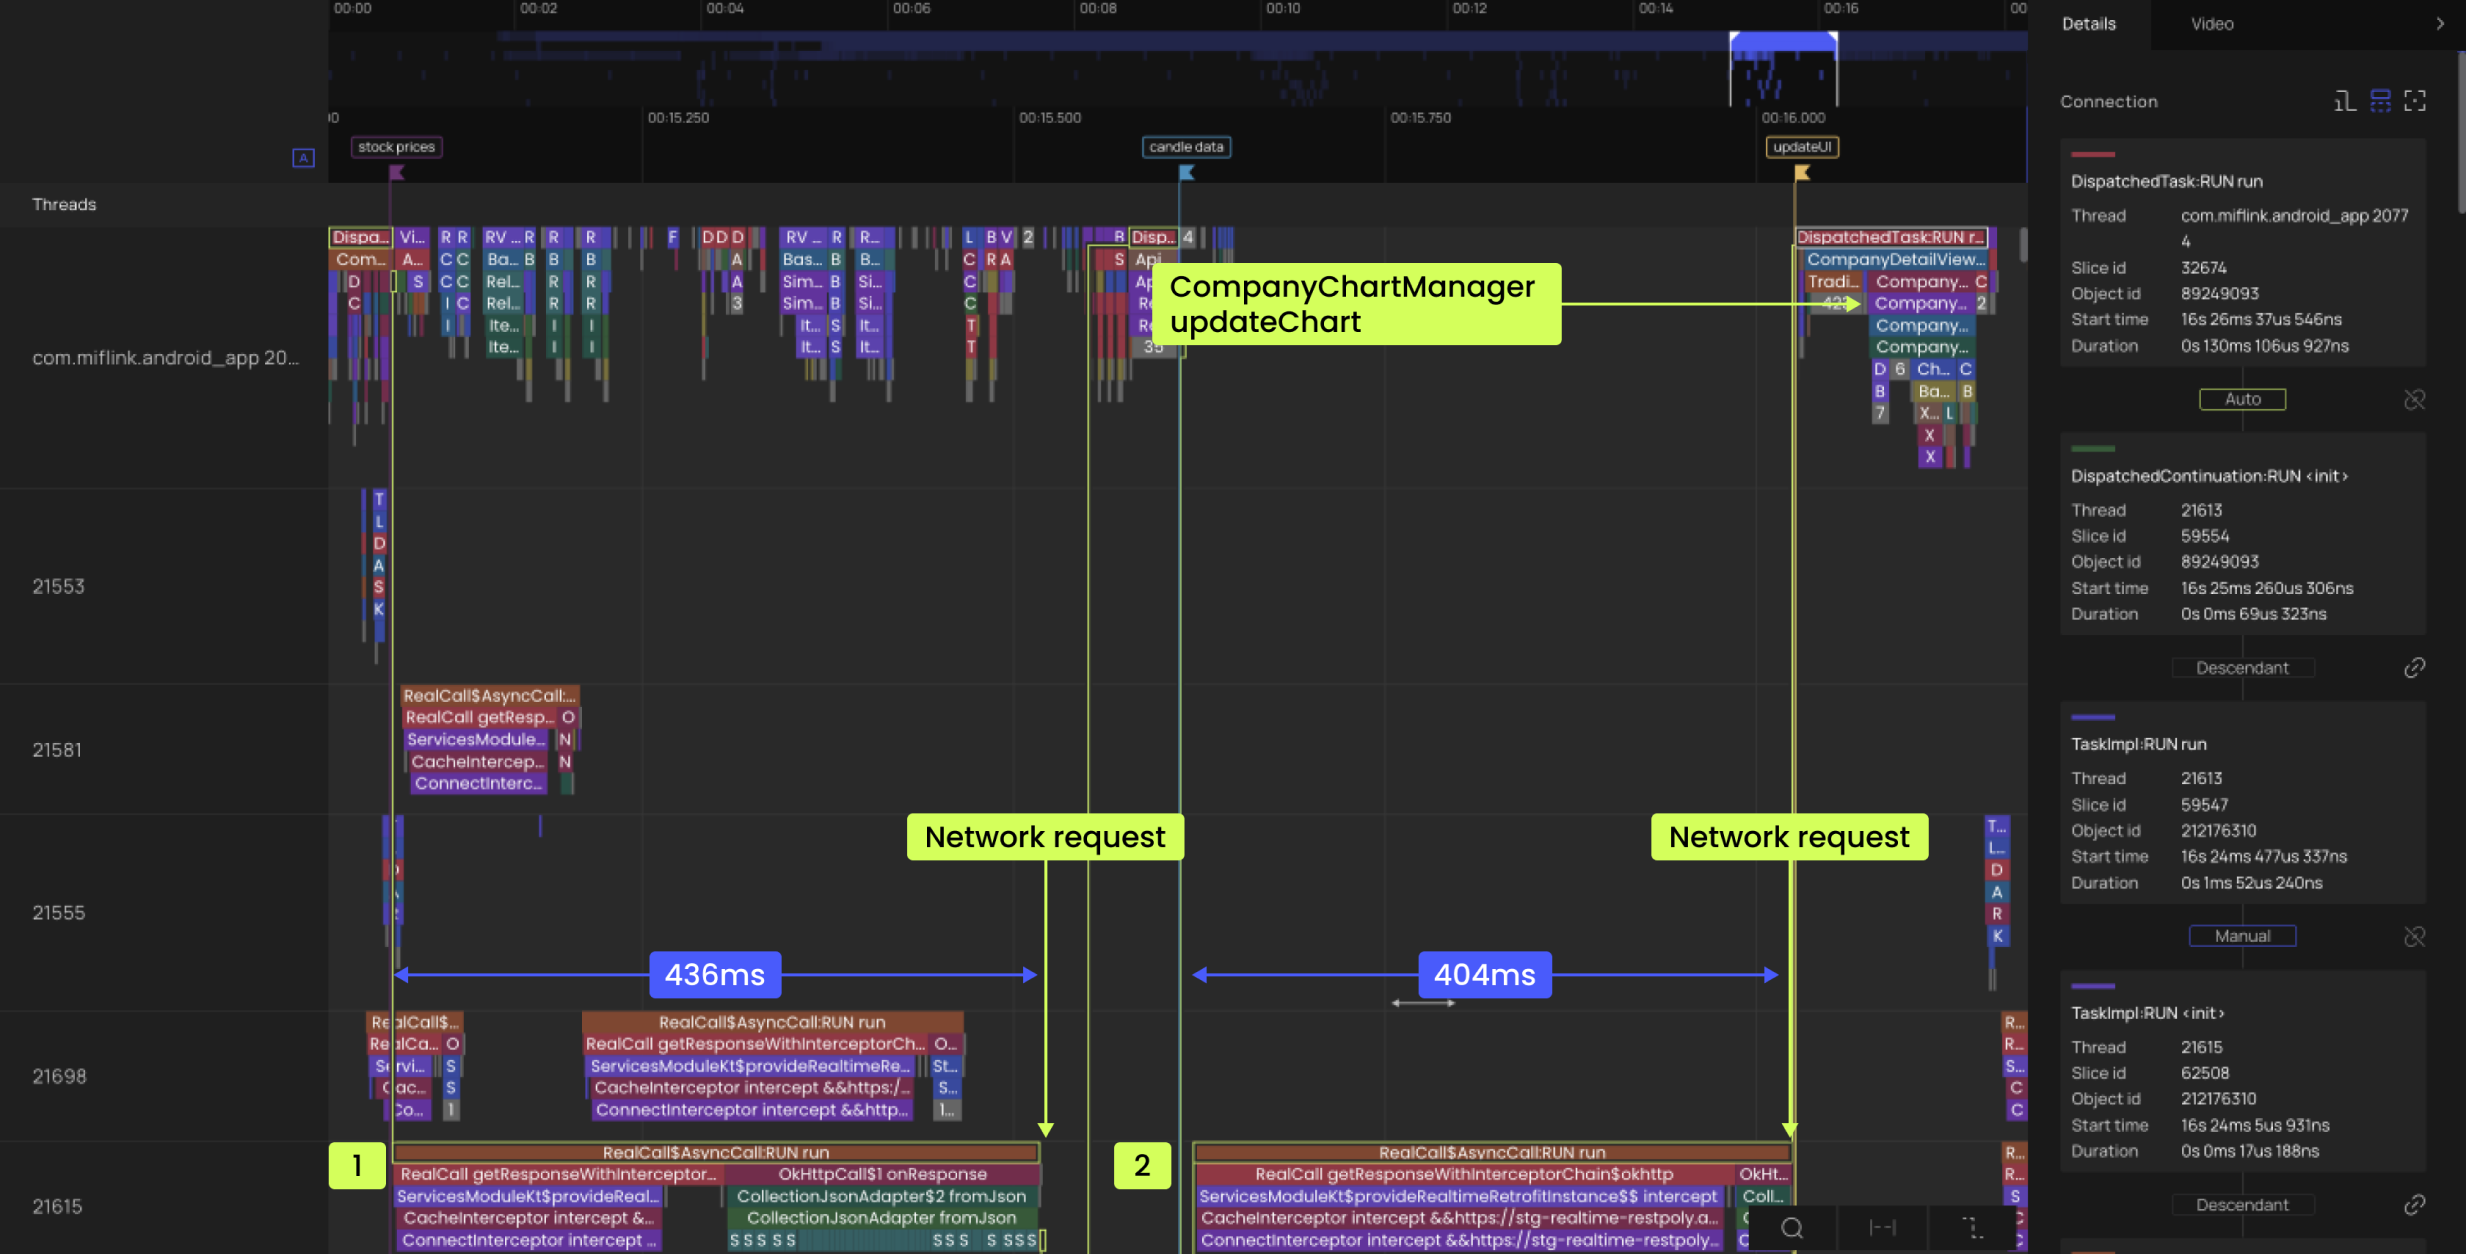
The first request fetched the stock prices for the charts and took ~436ms to execute. The second request fetched the candle data for the candle chart and took ~402 to execute. The execution path highlighted by the PS Tool indicated that neither chart was shown until both network requests had finished executing, even though all of the information needed for the line chart was available after the first network request was executed (Pic 5). The PS Tool showed that the execution of the second network request to fetch the information for the candle chart delayed the line chart from being made visible to the user. After all other information on the company page had loaded, it took an additional ~680ms before the line chart appeared.

CompanyChartManager updateChart can be called to update the UI to show the line chart right after the data for the line chart is available instead of also waiting for the data for the candle chart to be fetched. If the UI was updated with the results of the first request, and then updated again after the second request had finished, then the user would’ve been able to view the line chart while the candle data was fetched in parallel. The line chart was the default view for the graph, so the priority should’ve been to show the information for the line chart as soon as it is ready. Waiting for additional data to be fetched before updating the UI is a common delay identified by the PS Tool.
Unlike other tools, the PS Tool’s dynamic connections revealed the dependencies between the function calls across all threads. This is how the tool identified that the view model didn’t update until both network requests finished. In addition to this, the video panel also showed that the UI wasn’t updated until all of the data was fetched, even though all of the information for the line chart was already available. No other tools have these features, and without them, it requires much more time and effort to diagnose various types of performance issues. The PS Tool showed that rescheduling CompanyChartManager updateChart so that it updates the UI after the first network request has finished will allow users to see the line chart ~420ms sooner.
Conclusion
The unique features of the PS Tool were used to identify two delays in the execution of Flink’s code for their company detail page user flow. The ability to sync the UI delays with the delays highlighted by analyzing the execution path, allowed the suboptimal scheduling of the network request to be easily identified. The PS Tool identified the delays and provided clear evidence to the client on how they could reduce the delay by ~660ms. Reducing the delays for this critical user flow should help improve the experience for Flink’s users.


