
This article examines existing tools for investigating performance issues in Android apps, as well as introducing a new, more advanced tool for this purpose. It first describes profiling, then system trace tools, discussing their functionality and uses, and also their limitations in addressing performance issues effectively. It then explores a novel tool that records traces for Android applications, visually representing the executed methods and their interconnections. It offers insights on leveraging such tools to proactively identify and address performance issues before end-users experience them.
Working on performance mainly consists of two different parts.
Part 1. Monitoring
- Metrics and user interactions
- High-level picture of application + backend
- No code-level details
Part 2. App’s Instrumentation
- Analysis of the program’s dynamic behavior
- Provide some information about actual code execution
- Profiling/tracing approaches
Profiling
Let’s dive deeper into profiling. Profiling is an approach in which we automatically:
- generate some statistical summary of programming execution
- collect data on RAM/CPU utilization, frequency, and duration of functions’ calls.
How it works (sampling profiling):
- The program is interrupted during the execution
- The profiler visits all threads’ call stacks and collects data about running functions
- The profiler collects current memory usage
- The process is repeated during the whole execution (for example, ~ms)
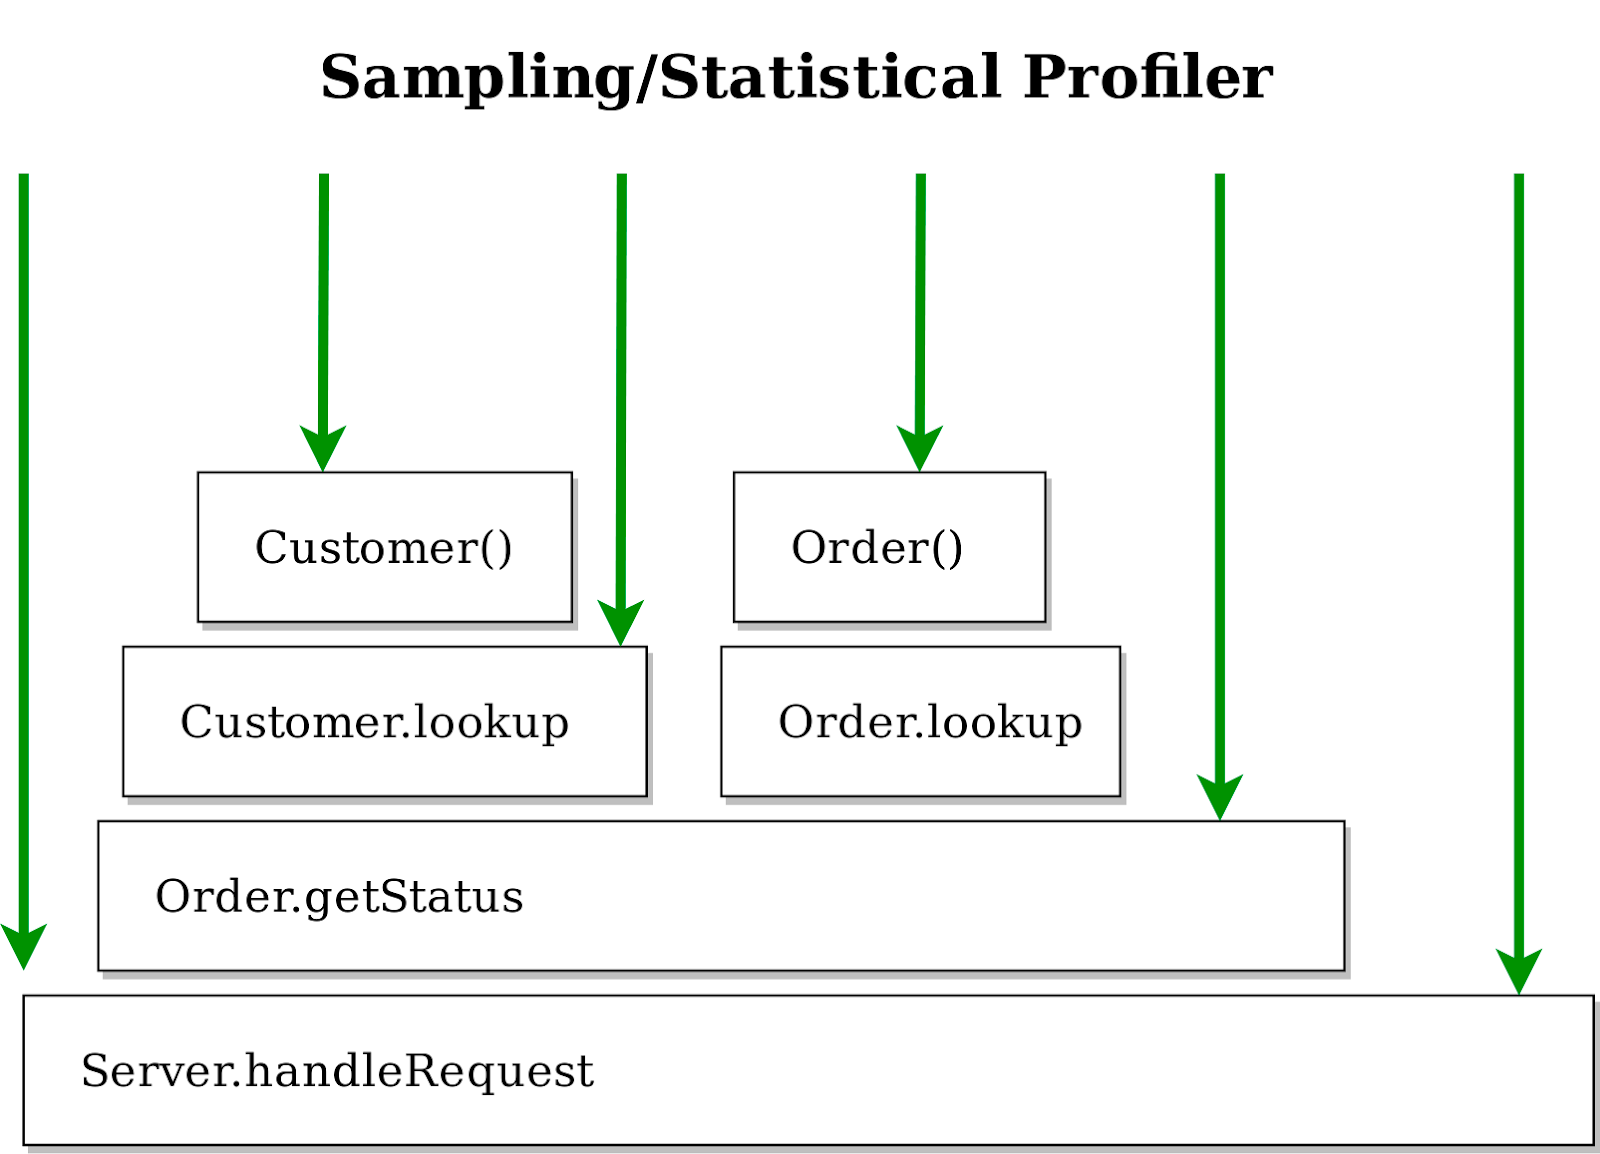
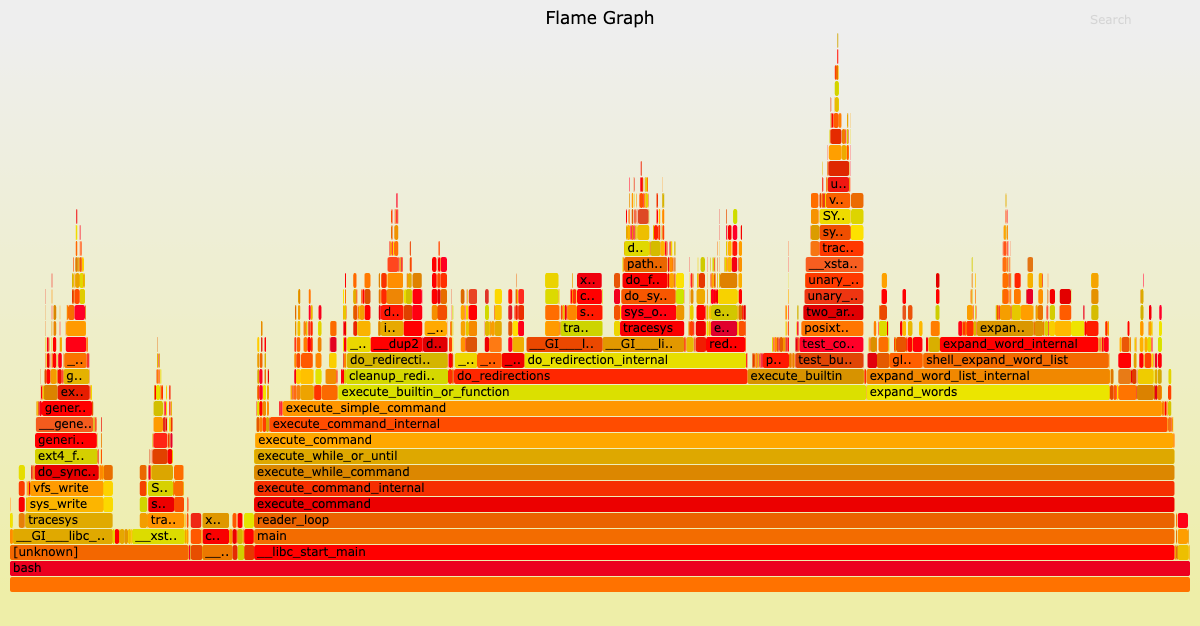
Such data is processed and visualized as a flame graph (how much time was spent on each method and how often each method is executed, but it doesn't have any time axis).
When to use
- Quick detection of slow and frequent method calls (or lines of code)
- Determine bottleneck methods to optimize in single-thread app
- Detect high CPU usage/memory leaks
Problems
- Output is highly overwhelmed
- Can’t visualize multithreading dependencies - useless for multithreading problems
- Sampling can lead to missing some methods
But it's still a handy, robust, and easy-to-use tool.
Profiling: Android Studio Profiler - Sampled Profiler
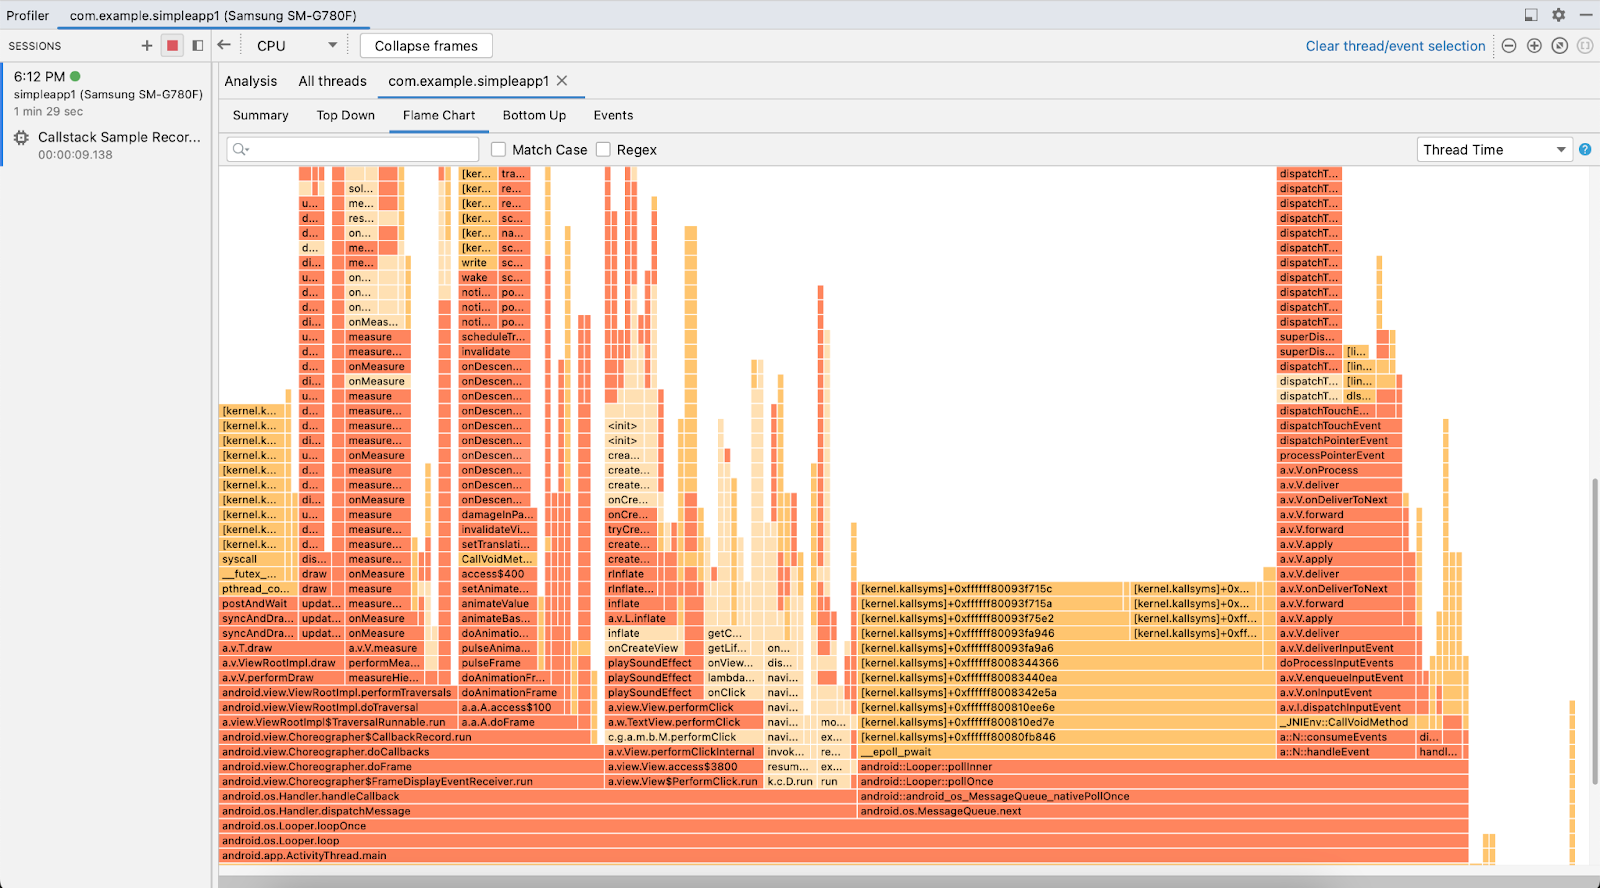
Android has Android Studio Profiler. You can run the application and easily record the sample profiles (select “call stack sample” and click on “record”). The flame profiling chart will display all calls but with no time axis, and it's hard to understand what happens in the program when this on-click method is called.
Live demo:
The second method is tracing.
What is tracing?
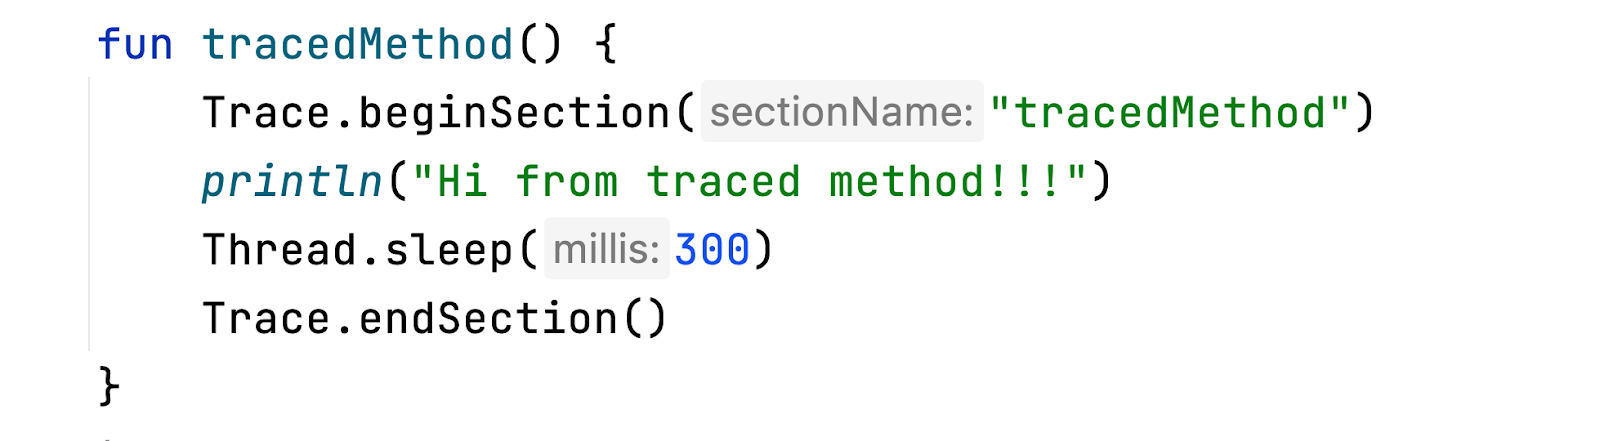
- The process of recording log events for a small program’s part execution: e.g. method
- Pair of events with timestamps are recorded: beginning and end of execution
- It may require a program to be instrumented (statements that create events)
How is it visualized?
Slice is pair of begin-end events for some traced code fragment
Each slice is associated with timestamps and thread
- Time axis is available
- Events execution are visualized in the actual order
- Multithreading dependencies can be visualized
Pros:
- The detailed trace contains all needed data for profiling (it is possible to calculate the same statistic about the frequency of methods, the average length of method execution, and, the memory usage/CPU utilization).
- Android supports the System Tracing framework for trace recording
- Android Platform is partially covered by traces and provides some visibility for frame's drawing, choreographer's update, execution task for animation, etc.
When to use:
- Visualization for some multithread program
- Manual investigation of multithreading performance issues
Problems:
- Requires careful code instrumentation
- Instrumentation of all code can lead to a big overhead and not a realistic picture.
- Require manual investigation of multithreading dependencies
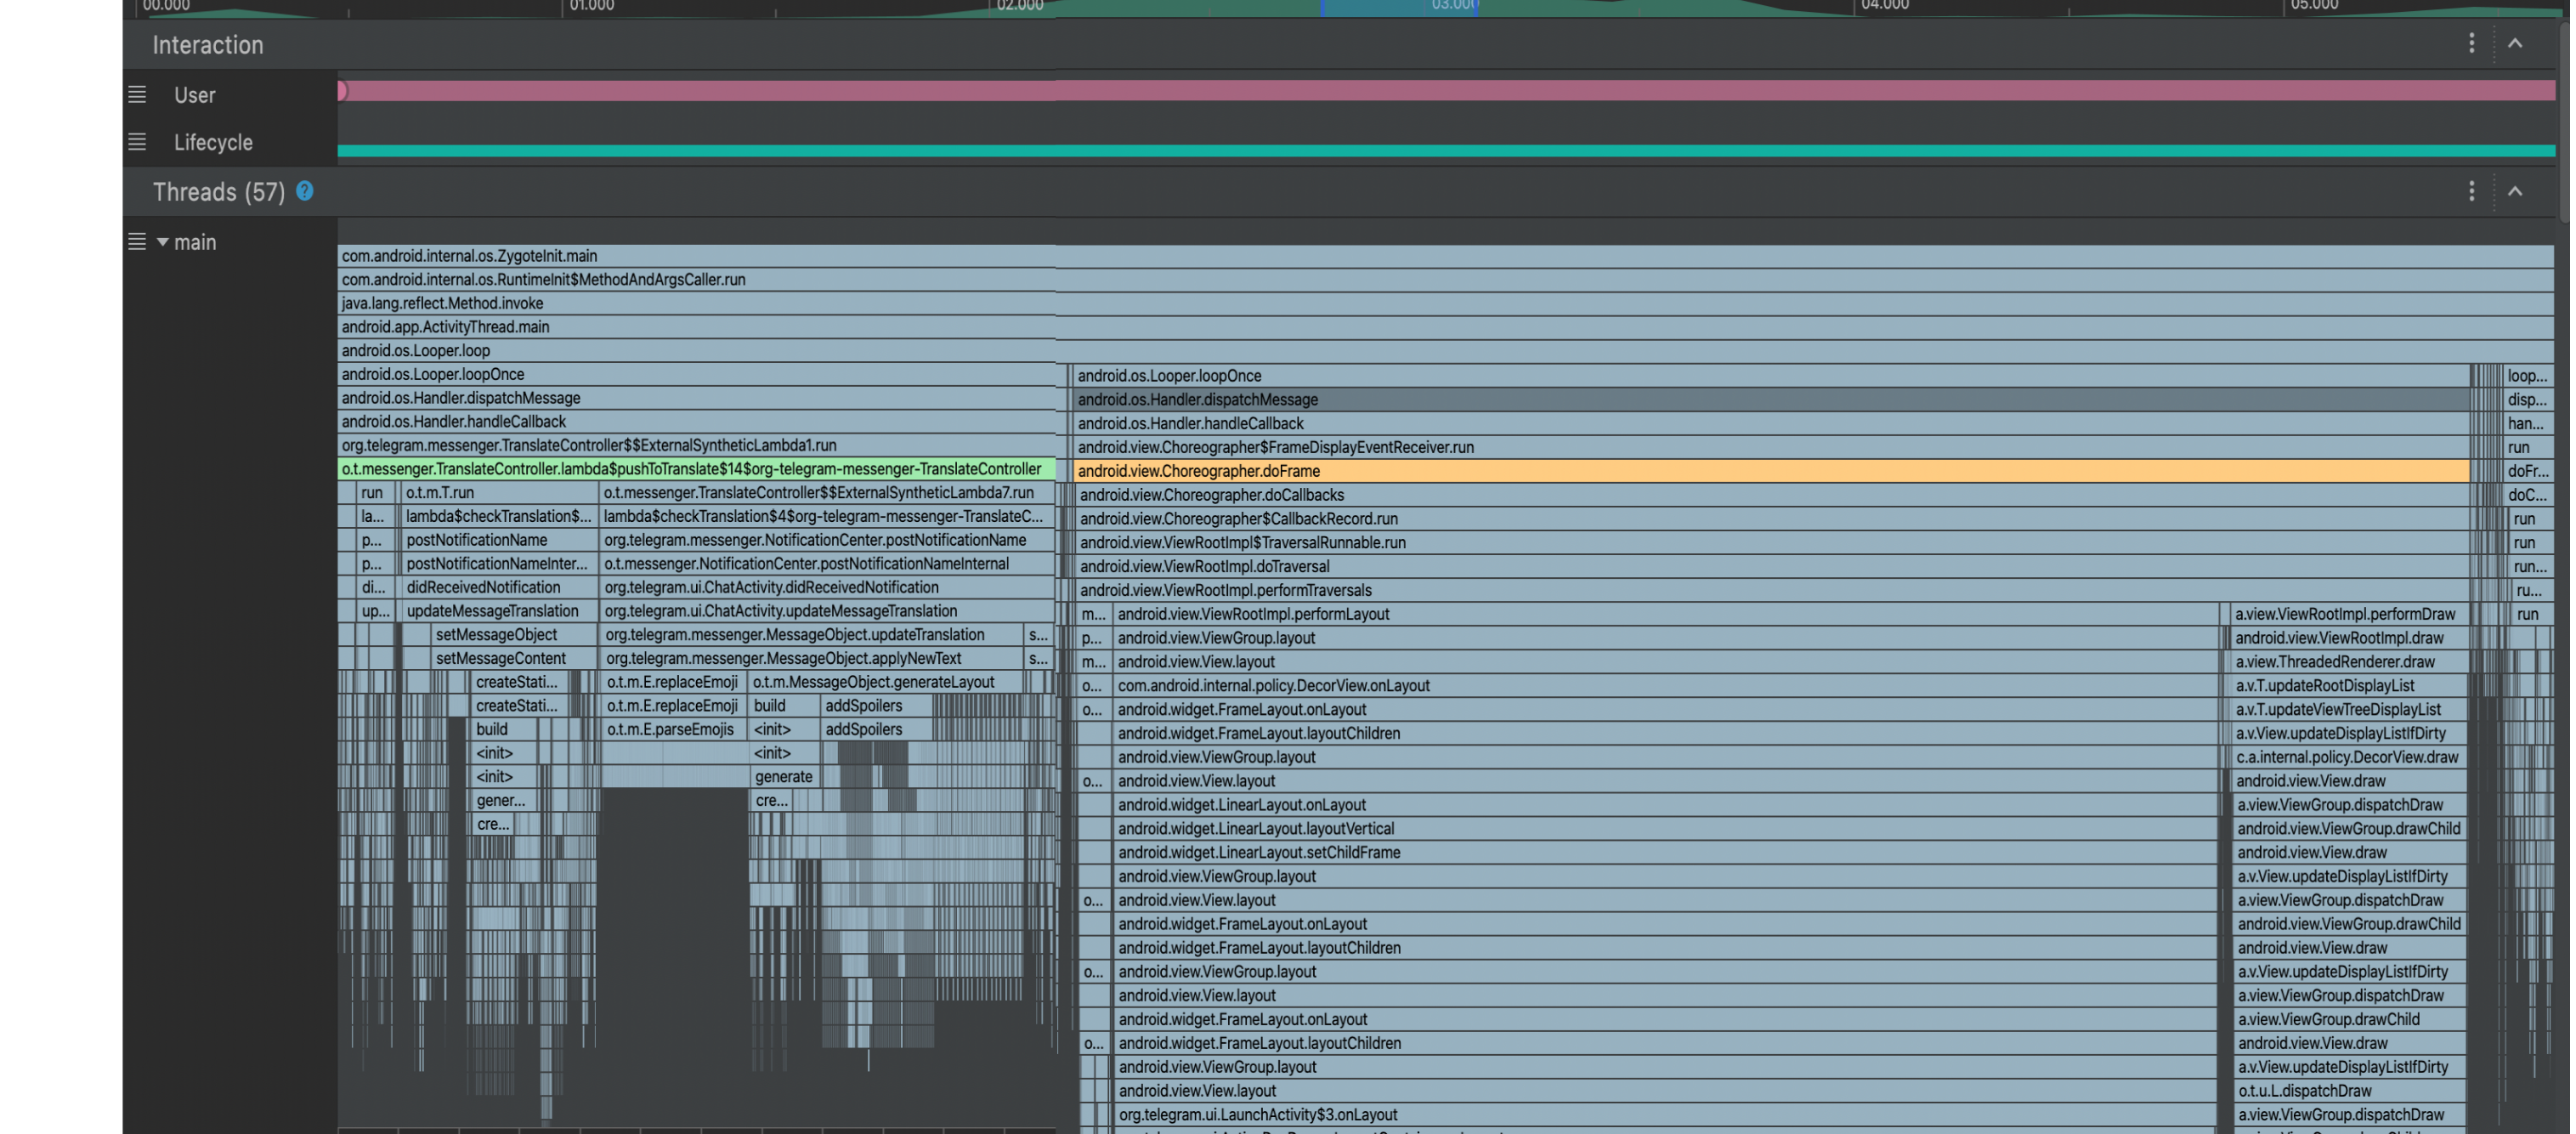
Overview of Tracing: Android Studio Profiler - Full Tracing
- All methods are presented
- The app is extremely slowed down
- Trace is overwhelmed
- Poor UI makes investigating multithreading logic quite difficult
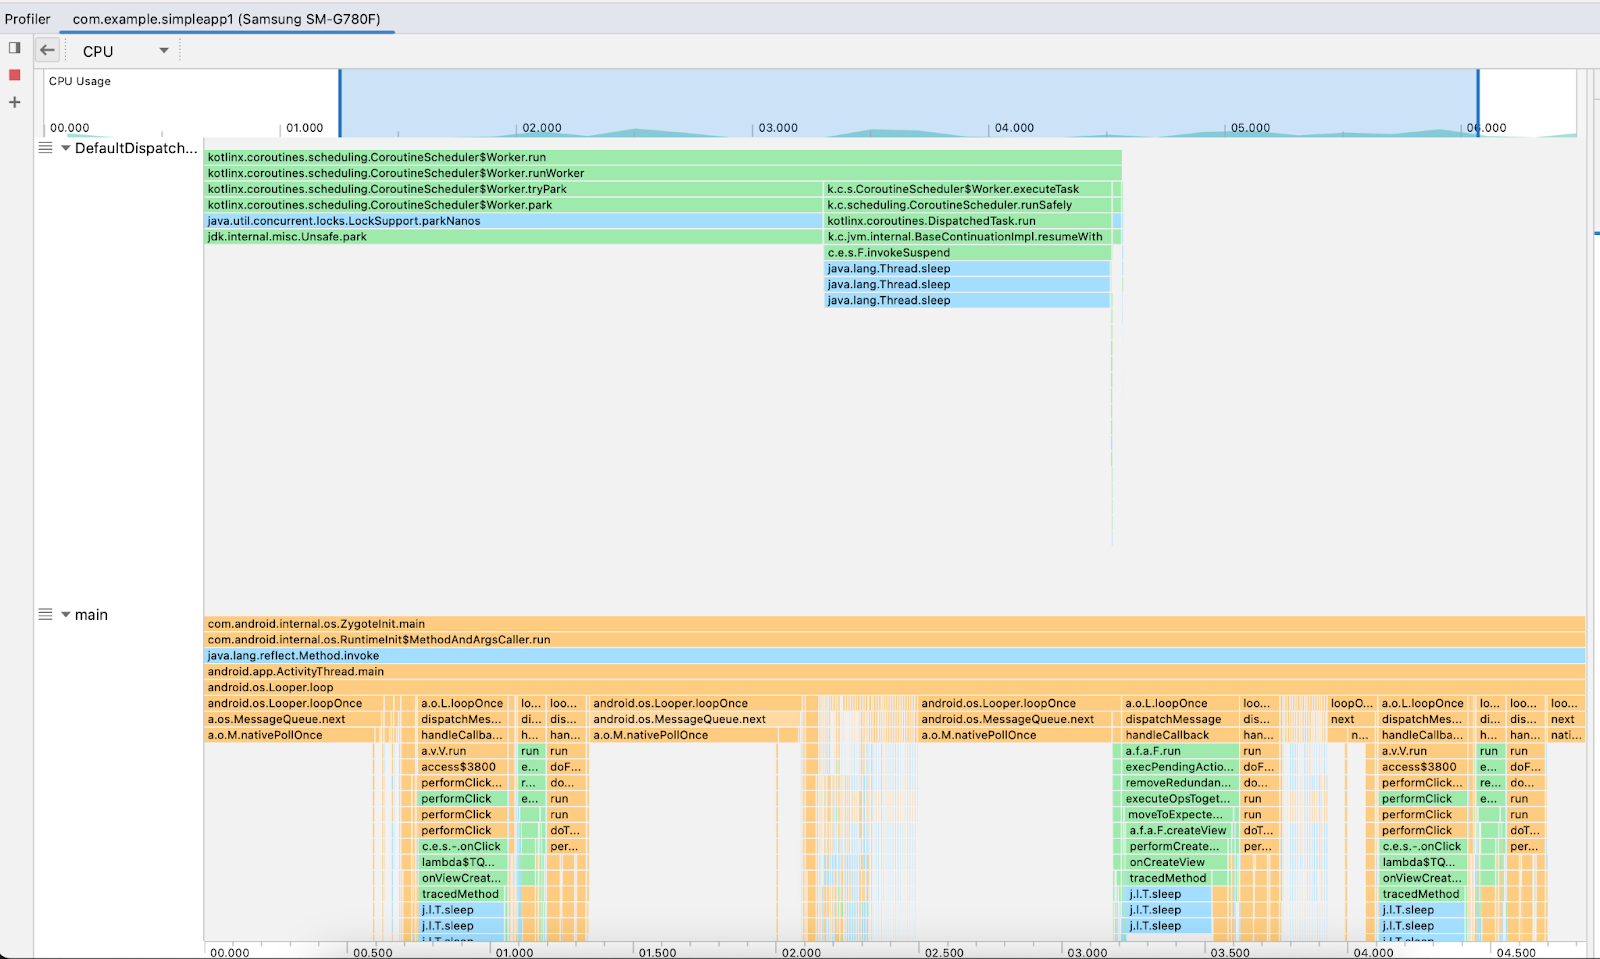
Live demo:
Android System Tracing
The Android Platform incorporates a built-in framework called Android System Tracing for recording traces. One notable distinction between System Trace and Android Studio's Full Tracing is that traces obtained from System Trace do not encompass instrumentation for all methods. By default, these traces contain solely information from the Android platform, although the framework permits the inclusion of custom data in the trace. The level of detail regarding platform information can be adjusted through device configuration settings. More info about System Tracing.
Pros:
- Android framework for recording custom traces
- Android platform is partly covered
- Simple manual injections
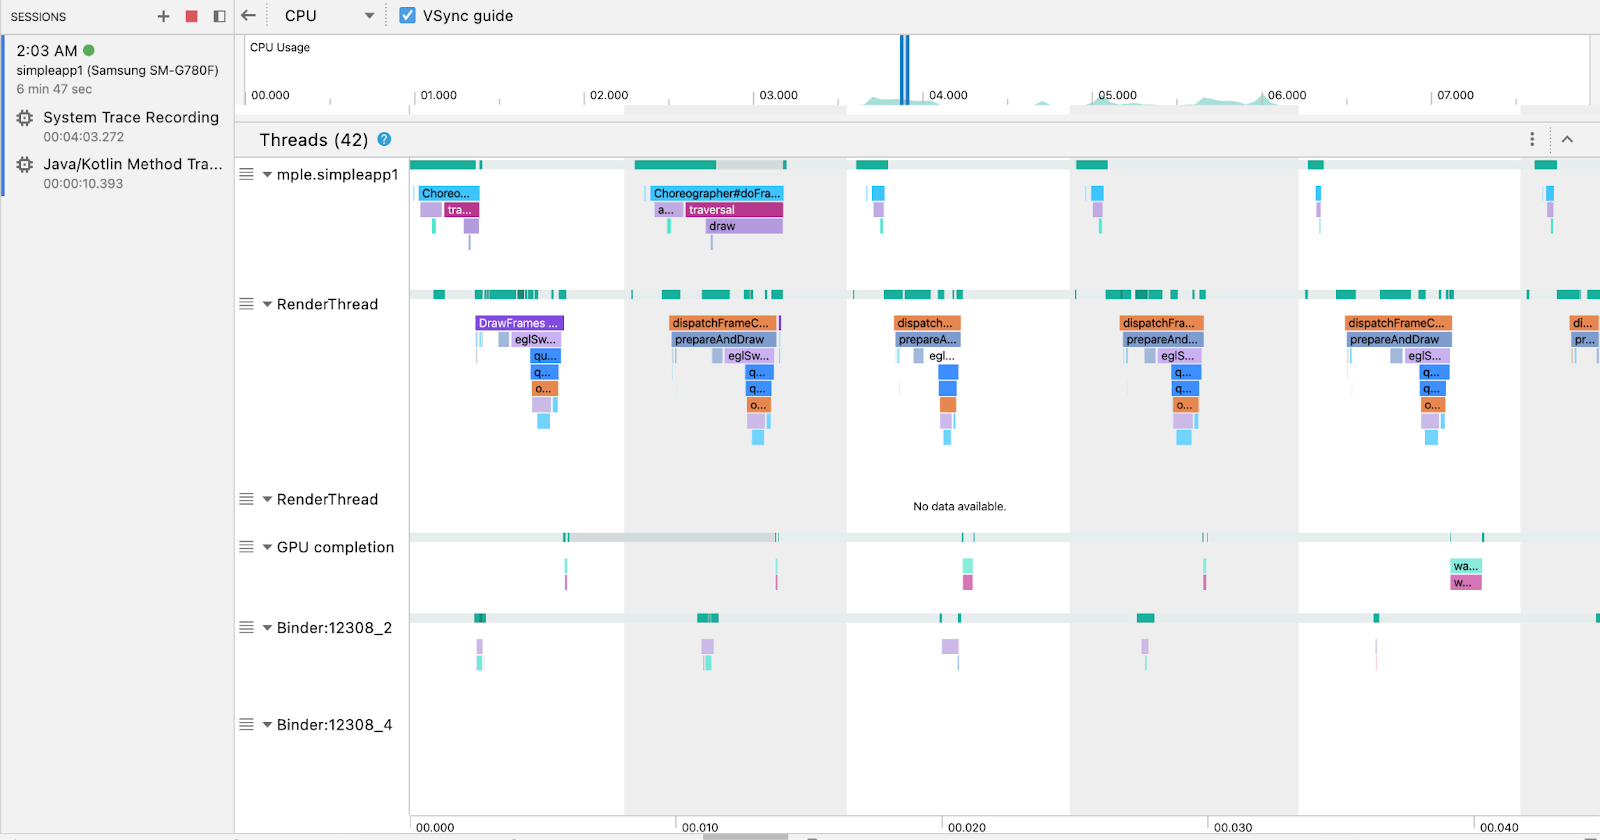
Tracing: Android Studio Profiler - System Tracing
The Android Studio Profiler provides support for visualizing System Trace through its System Trace mode. However, the user interface of this tool presents challenges, making it difficult to work with.
Tracing: Perfetto Tool - System Tracing
Perfetto is a robust tool for visualizing traces, particularly for working with Android System Trace. Therefore, it will be utilized for the subsequent examples.
Perfetto facilitates seamless navigation through threads and slices by offering features such as thread pinning and flags.
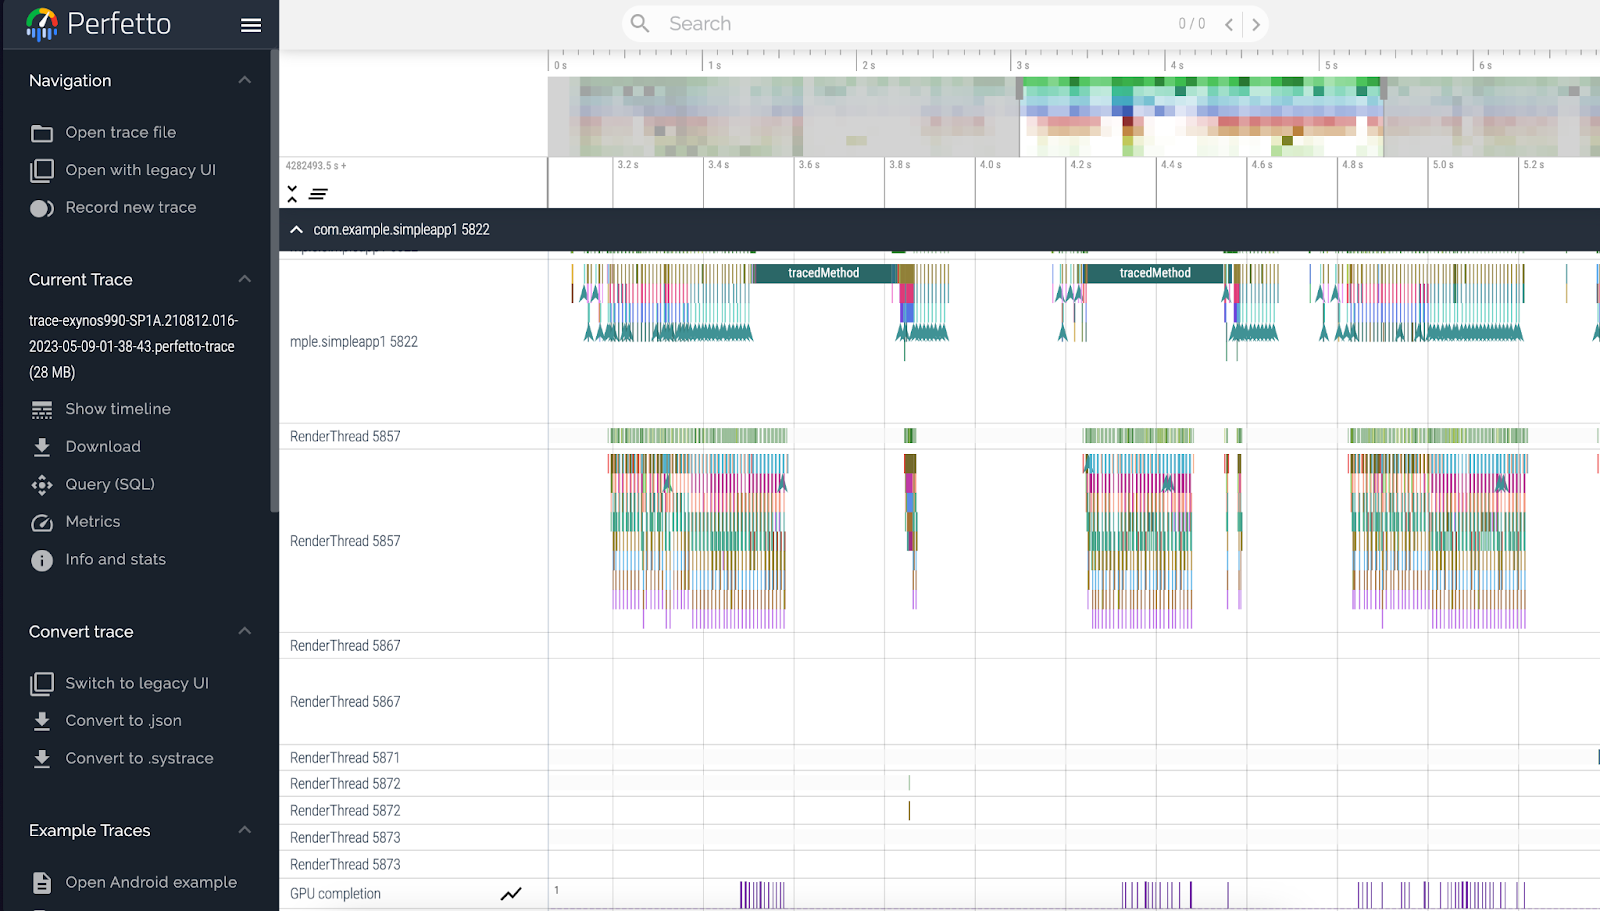
Live demo:
Leveraging Tracing for performance optimization
How to use these tools?
- Get signal from observability - some metric or user action that causes a delay.
- Localize issues in code
- Add trace events into all involved methods
- Analyze threads to detect a sequence of calls that trigger slowing down
Example of the manually traced app (adding slices and searching)
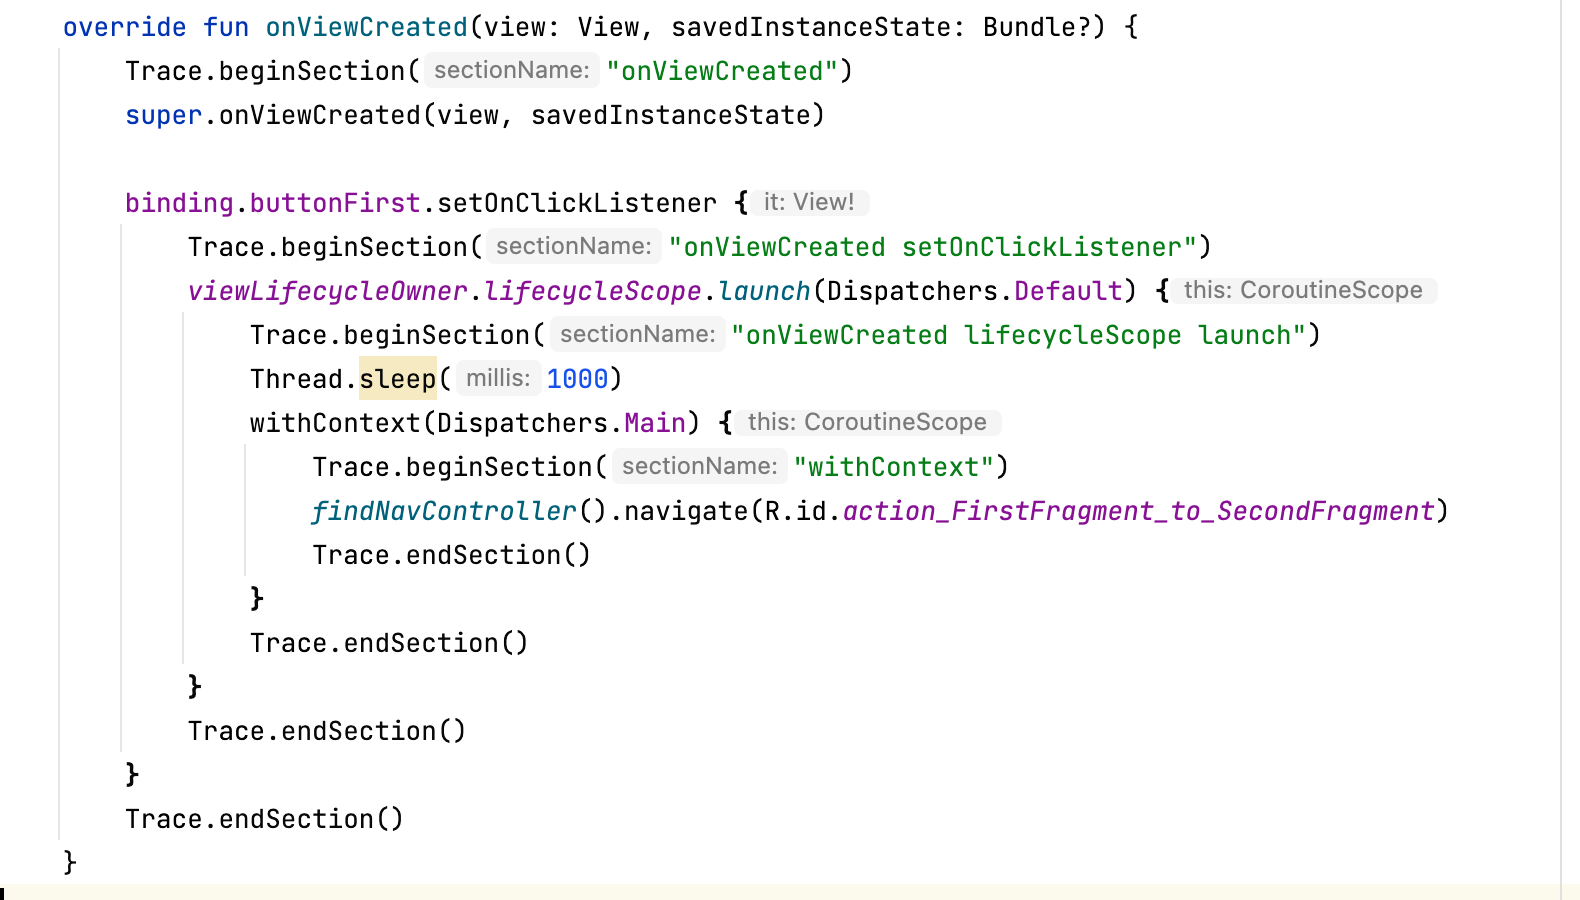
Live demo:
Problems
- Manual program tracing is required. Enormously hard for real applications
- Tracing is working on the method level, but target metrics are higher. Follow logic though multiple threads are required
- Following the logic in multithreading problems is hard in a real application
How to resolve those issues?
User Flow
To begin, it is better to shift our focus from individual method calls to a higher level perspective. Introducing the term "user flow" is a preferable approach.
A user flow is a single-step process that originates from an Action performed by the user within the application and concludes with a satisfactory response, known as a Reaction, from the app.
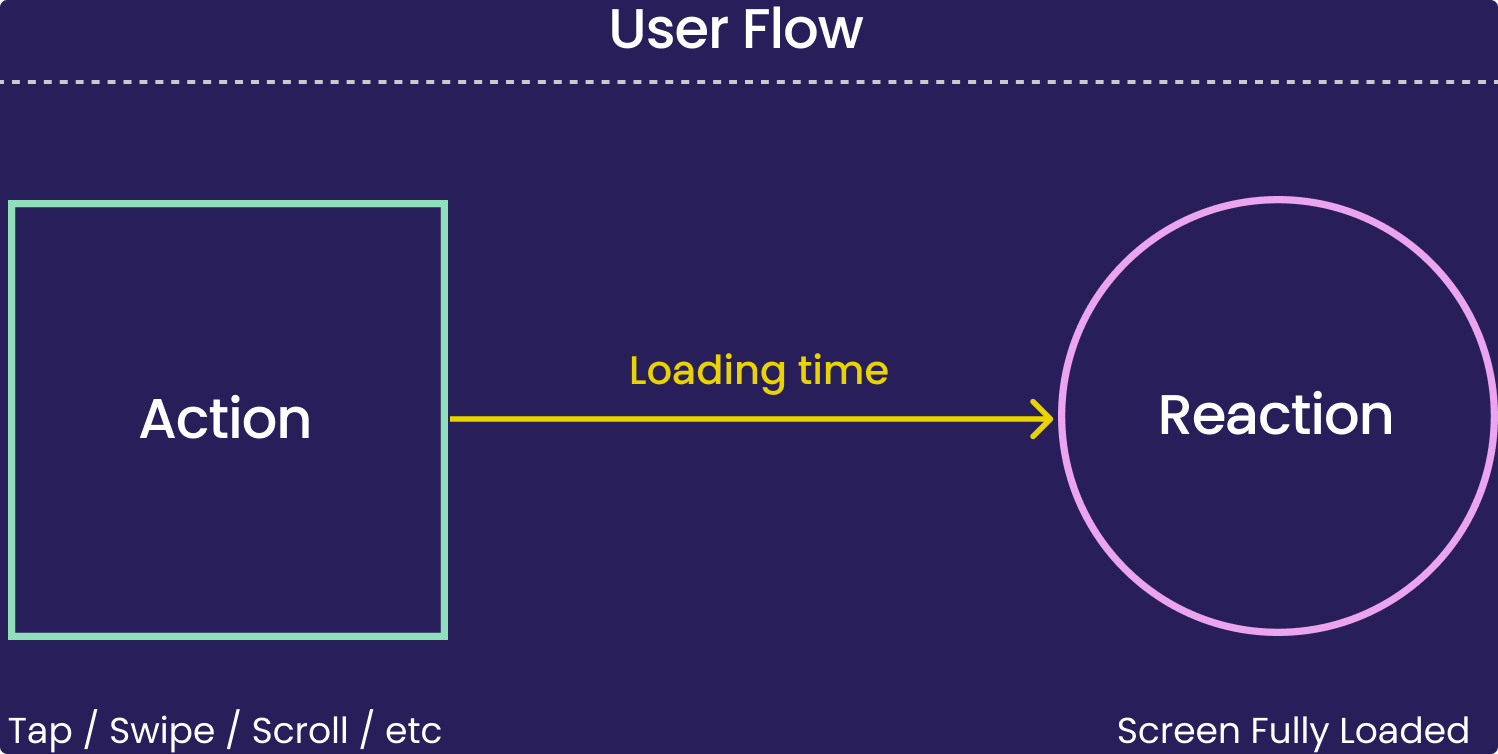
On the code level, User Flow corresponds to a sequence of method calls that are triggered by an Action and lead to the app’s Reaction.
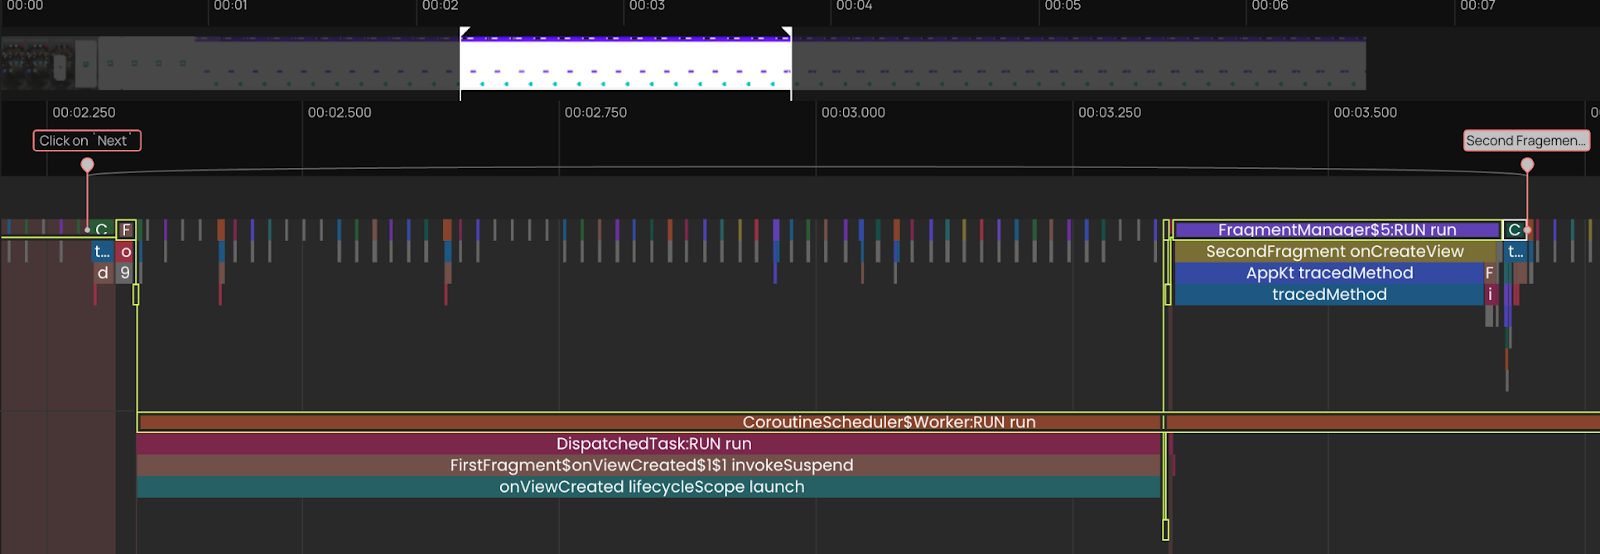
For example, in our case, we have:
- Action: Click on the “Next” button
- Reaction: Second Fragment appeared
User Flow is directly related to user experience, usually measured with observability tools and will be considered like a minimal primitive to optimize.
App’s Tracing:
The PS Plugin employs two key mechanisms to ensure the generation of informative traces while minimizing noise:
- Automatic instrumentation of all methods within the application: The plugin seamlessly incorporates instrumentation into every method of the app. This comprehensive approach enables a more detailed and accurate trace capture, facilitating in-depth analysis and debugging.
- Iterative procedure of filtering: The plugin implements an iterative process of filtering to refine the captured trace data. By progressively applying filters, it eliminates irrelevant or extraneous information, thereby enhancing the clarity and relevance of the resulting traces. This iterative filtering procedure aids in focusing on the most significant aspects of the trace data for effective analysis and troubleshooting.
VS
.png)
By adopting this approach, it is possible to achieve a noise reduction of up to 95% when compared to Full Tracing.
Results:
- Manual tracing is not needed
- Trace is not overwhelmed
- app’s performance is close to original
- easy to find relevant methods without noise
Execution Path
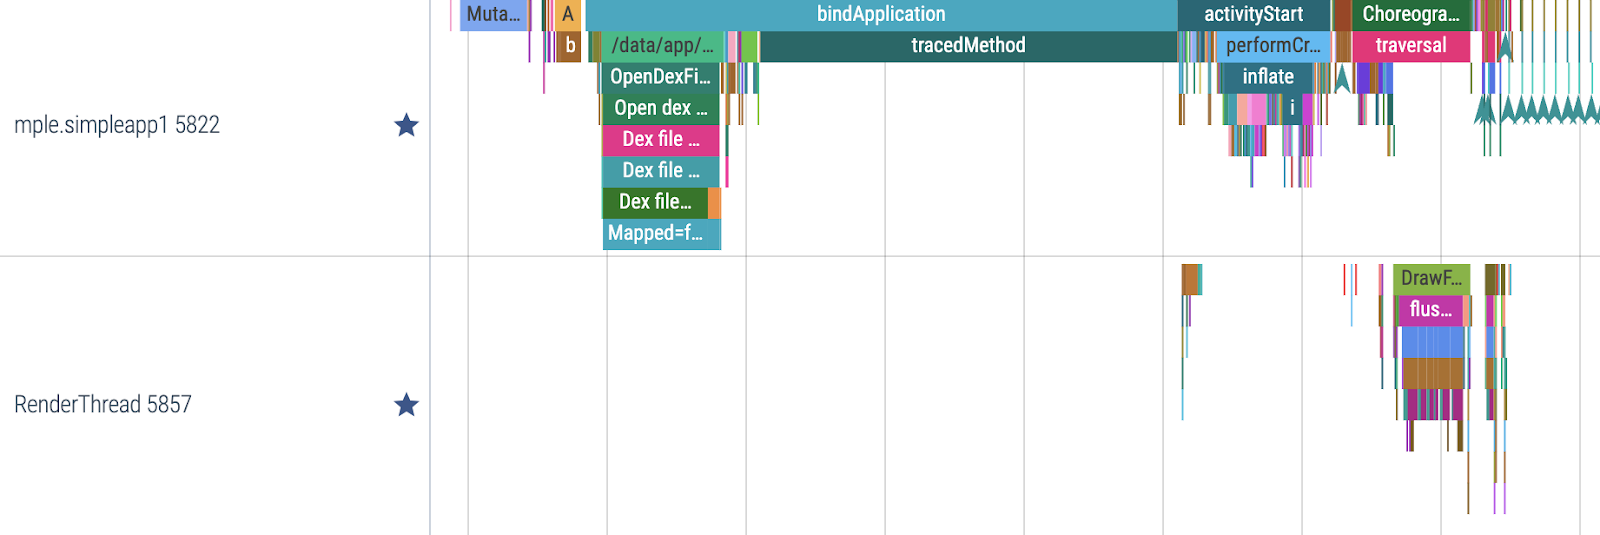
PSTool is showing not only a method’s call itself but also when and where it was scheduled. For that, we’re working with execution paths. What is the execution path in the case of a multithreading app?
Execution Path - a sequence of methods calls that are triggered by an Action and execute the app’s Reaction:
- The execution Path may go through several processes
- Each method call executes the following method or schedules its execution asynchronously
- Each method is blocked by the execution of the previous one
The execution path feature enables seamless tracking of the application's execution logic across various threads, requiring minimal additional effort. It establishes a connection between the user flow's action and reaction, providing visibility into each method involved in the execution process.
Live demo:
Pros
- PSPlugin records the execution path automatically
- The multithreading app’s dependencies are available on traces
- Manual threads investigation is not required
How to use PSTool?
The final process eliminates most of the manual steps:
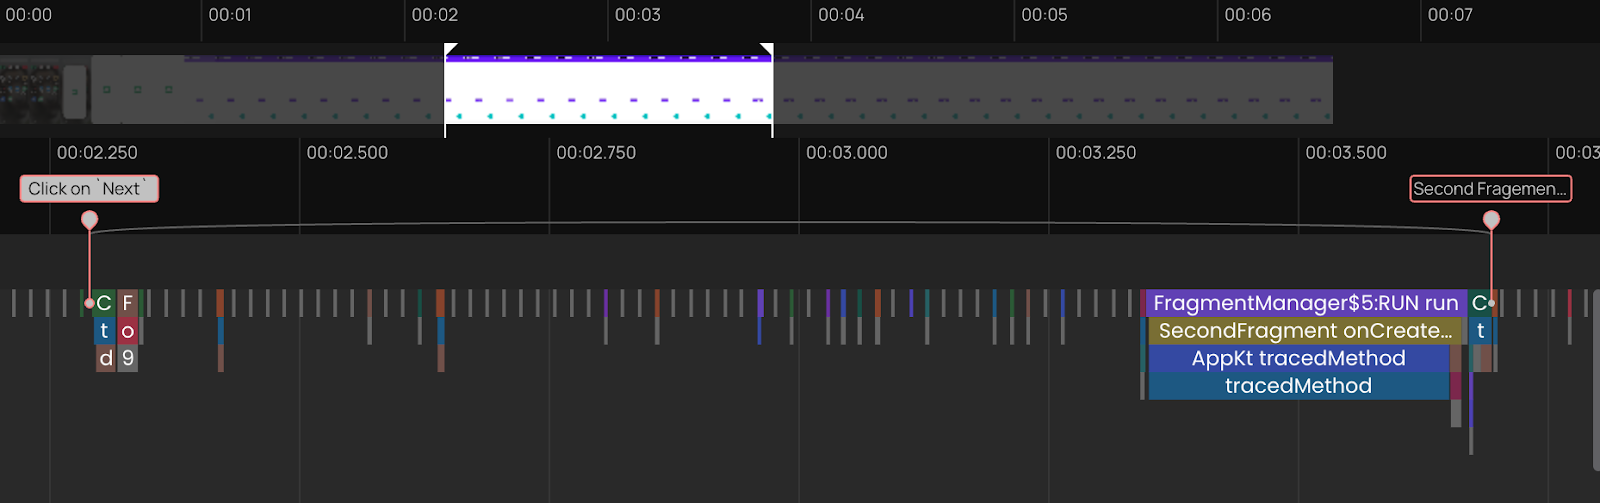
- Identify the start and end of User Flow in the video matching it with signals from the observability tool if they exist
- Easily spot the method calls that correspond to the reaction phase. PSTool automatically aligns the trace data with the video and displays each frame's drawing
- Take a look at the execution path and figure out why the reaction is being delayed
.jpeg)
Live demo:
What can you achieve with Product Science?
- Performance-oriented dev cycles. Reduce the cost and time of performance engineering. Efficiently identify main thread hangs, parallelization issues, duplicate function calls, and more through easy-to-read visualizations. Quickly fix any regression and APM alerts.
- Better engineering initiatives prioritization. Summarize performance opportunities into reports that make prioritizing easier.
- Customer experience is the top priority. Systematically correlate the customer experience of your app with traces to focus on what matters most for the users and enhance monitoring.
- Quicker adoption of new technologies. Introduce new libraries, languages, and changes to the client-server protocol with complete visibility of how they influence app performance.
- Optimized app releases. Catch performance issues in your dev builds before they impact your customer. The code you ship with the PS Tool is 30-70% better optimized.
Watch the full video
About the author: Gleb Morgachev is a software engineer with a background in data science. He’s a roundtable member of CodeMining at Open Data Science, placed third in the NLP2CMD competition at NeurIPS 2020, and has presented various published research and reports at multiple conferences worldwide.
Acknowledgements: Thanks to Vitaly Khudobakhshov, David Liberman, Oleg Pashkovsky, Anastasia Matveeva, Misha Kuznetsova and others.
If you’re interested in tackling challenges like this, join our team! Time is humanity’s most valuable non-renewable resource. Our mission is to help all people in the world stop experiencing delays from software inefficiency.
.jpg)